Understanding Your Dashboard Analytics
This guide will walk you through accessing and interpreting your dashboard's analytics. Track views, understand user engagement, and review important activities. Note: This feature is exclusive to paid dashboards.
How to Access Your Dashboard Analytics
- Navigate to the detail view of the dashboard you want to analyze.
- Click on the 'More' button, usually represented by three dots or a similar icon.
- From the dropdown menu, select 'Analytics'.
- If this option is disabled or not visible, it means the dashboard is not on a paid plan. Upgrade to access analytics.
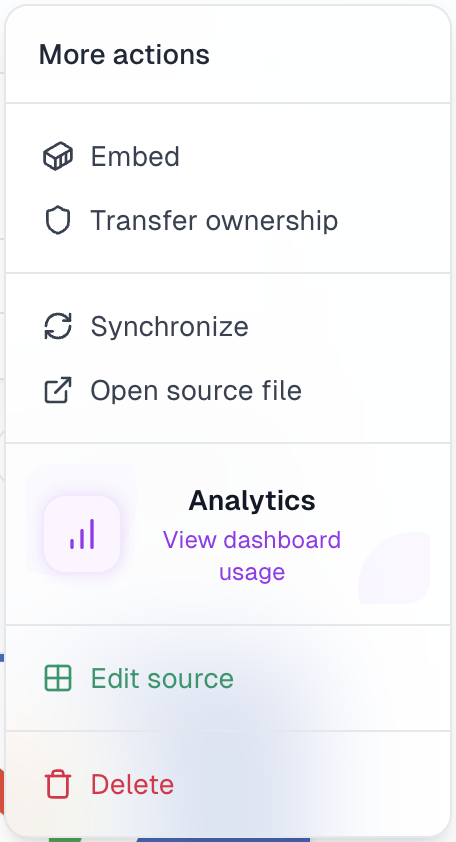
Premium Feature
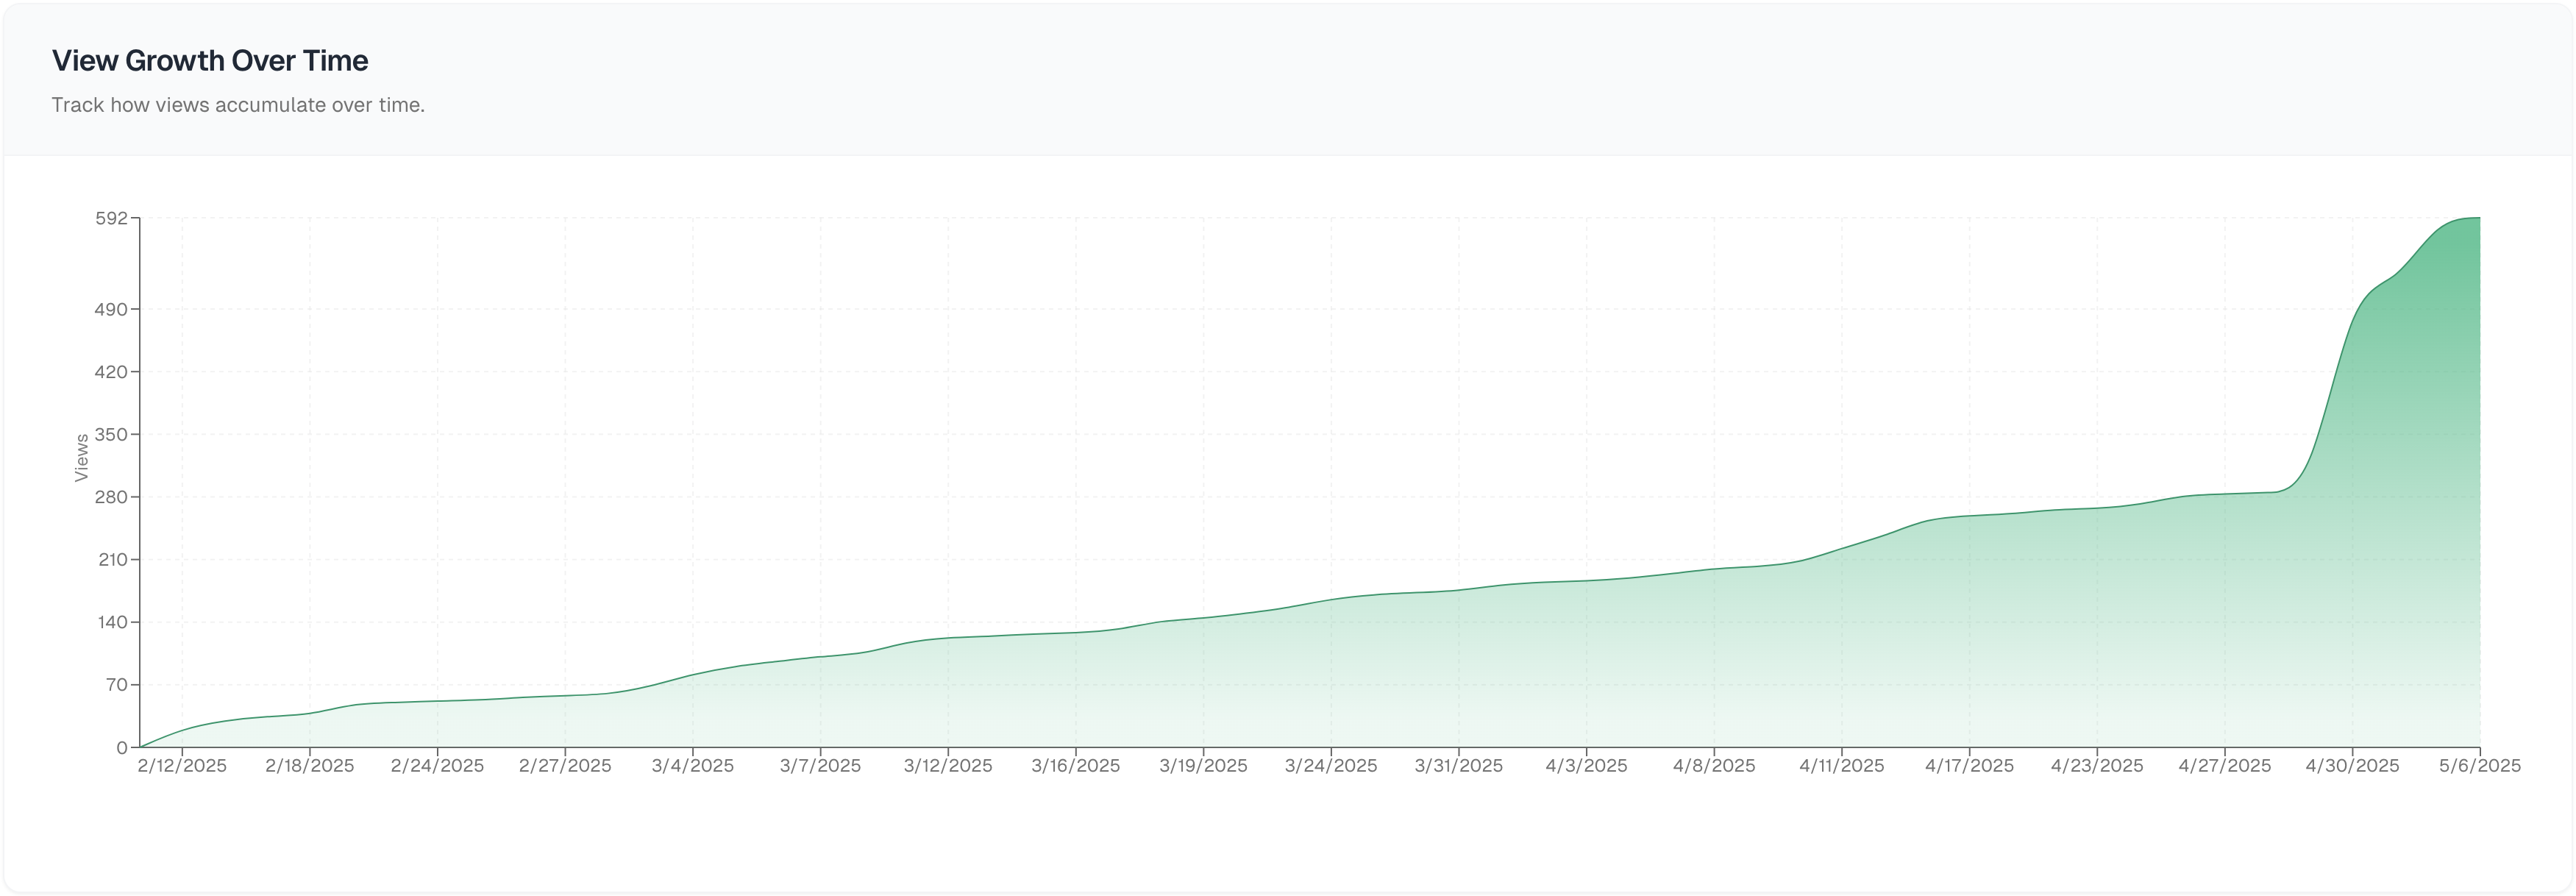
Analyzing Your Views
Get a clear picture of how your dashboard is being viewed.
Logged-in vs. Guest Viewers
Percentage of views from users logged into Boardly.
Percentage of views from guest users.
In-App vs. Embedded Views
Percentage of views originating from within the Boardly application.
Percentage of views from embedded dashboards on external sites.
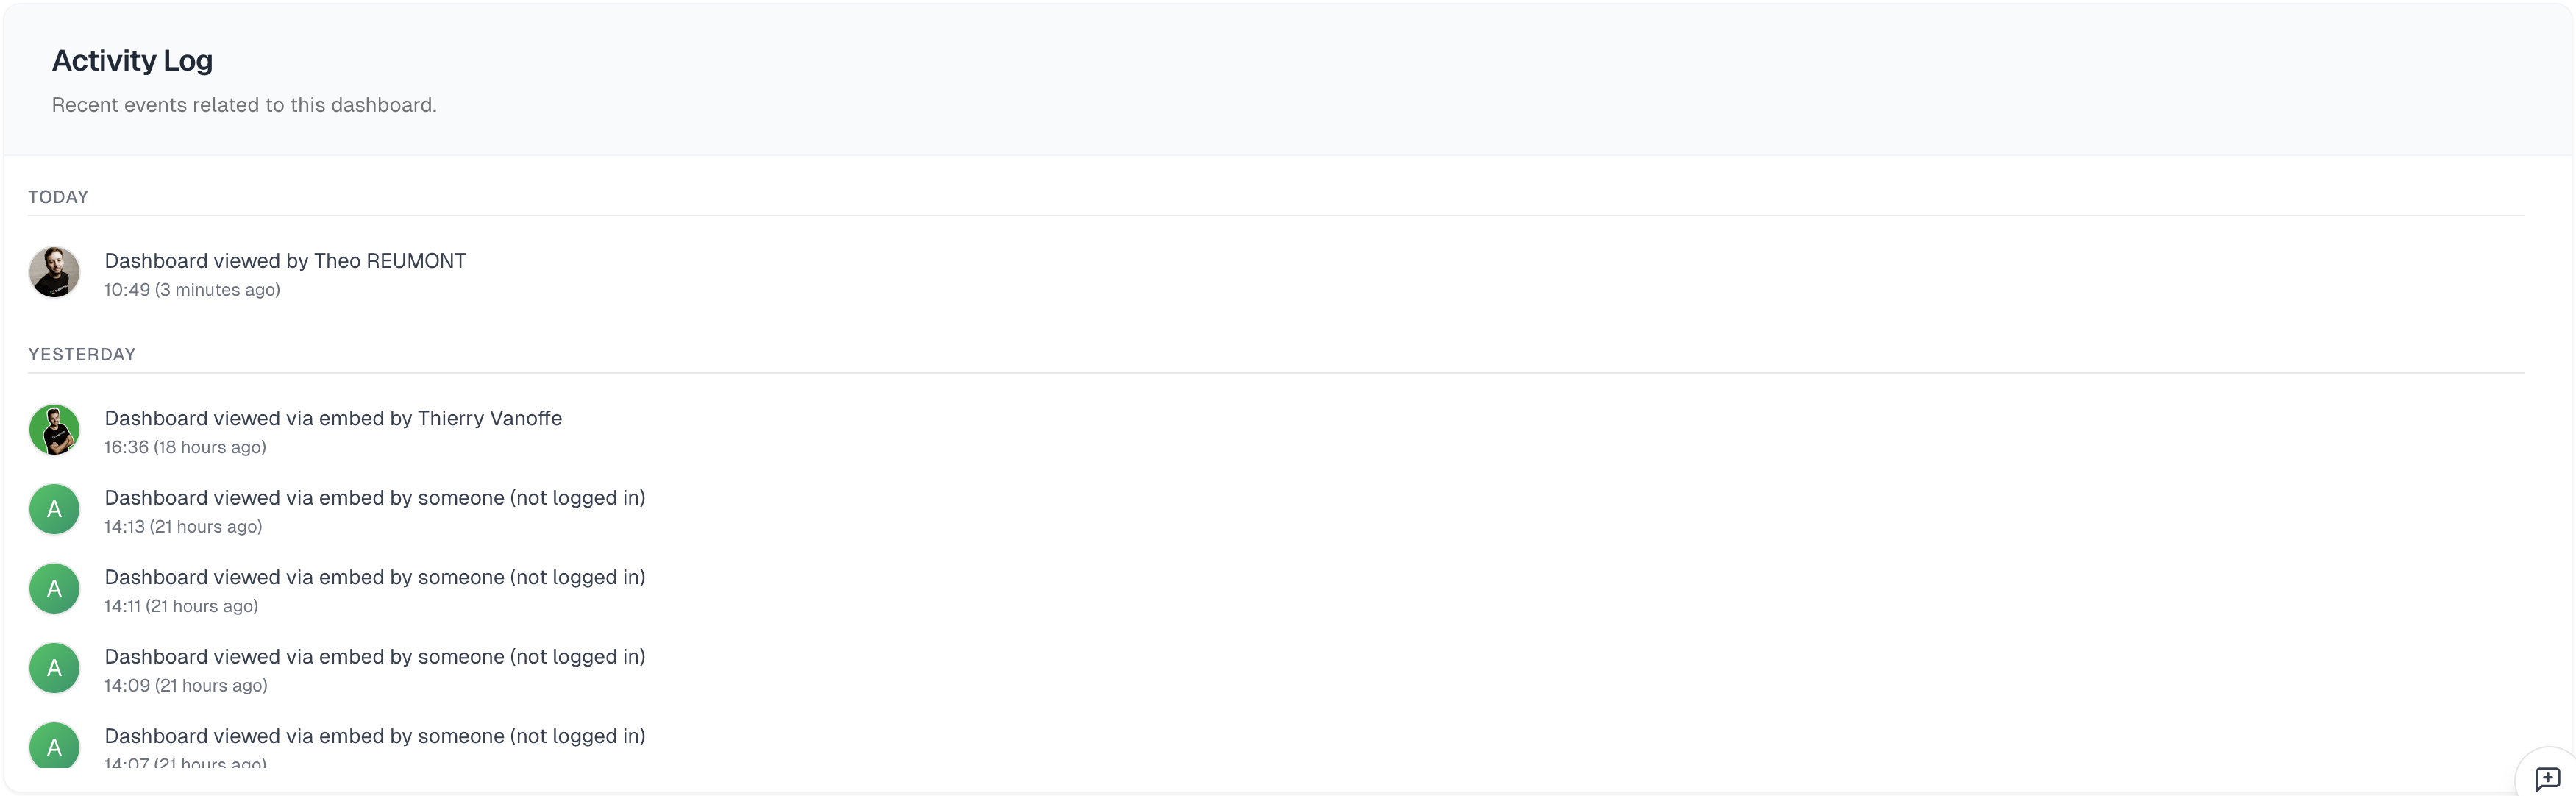
Dashboard Activity Log
Keep track of all significant events related to your dashboard. Each event is timestamped for easy reference.
Example Events:
- Dashboard created by User A
- Data source updated by User B
- Dashboard published to public
- New comment added by User C
- Access permissions changed by Admin
No activity has been recorded for this dashboard yet.
Quick Tip
Remember, the 'Free Preview' is a great way to test how your dashboard looks when published, but it's limited. For full sharing capabilities and no restrictions, use a paid dashboard slot from your plan.